PrismaLens CLI
The PrismaLens CLI (prismalens, alias pl) investigates a firing alert the same
way an on-call engineer would: it reads the repo, queries your read-only
telemetry, and comes back with an ordered-evidence report — hypotheses
ranked most to least plausible, each one backed by evidence it actually
gathered. No PrismaLens account, no subscription — you bring your own model
provider key. It’s open source, Apache-2.0 licensed.
New here? The Quickstart walks install → pl doctor → your first
investigation end to end. This page is the CLI overview and install reference.
See it in action
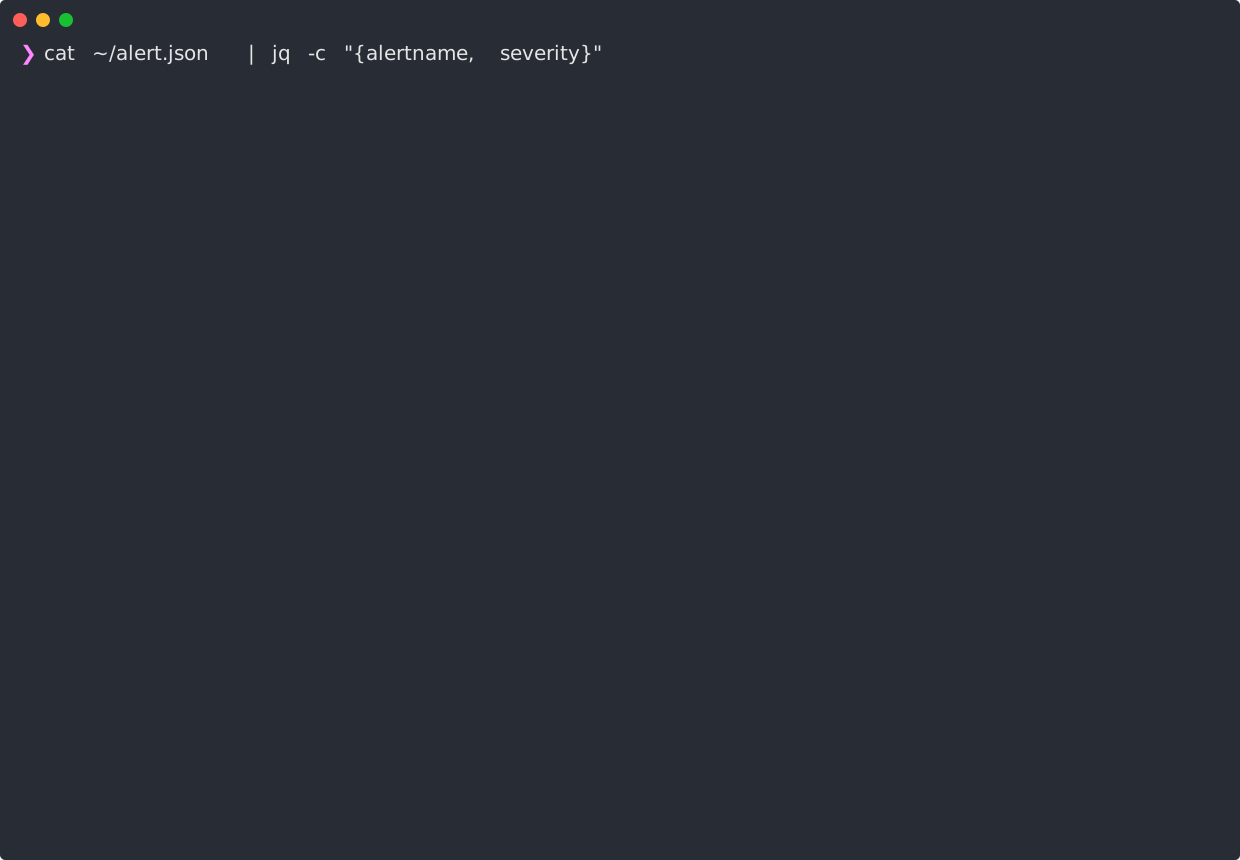
Section titled “See it in action”A real, unscripted recording: a p99-latency alert from a live demo stack is
piped into pl investigate. The CLI streams the investigation as it happens,
then prints the report — here it reasons from the source and traces the latency
to a book-lookup endpoint that skips caching and blocks on a slow external API
call, with the fix ranked first in the next steps.
The raw asciinema recording is also available.
Install
Section titled “Install”Requires Node.js 22.13 or newer (the CLI uses Node’s built-in
node:sqlite for its run record store).
Try it without installing anything:
npx prismalens doctorOr install it globally:
npm install -g prismalensBoth prismalens and the shorter pl alias point at the same binary. Confirm
the installed version with pl --version.
Before your first run
Section titled “Before your first run”Two things need to be in place before your first investigation:
- A harness binary on PATH. The CLI doesn’t investigate on its own — it
rents an agent harness to do the read-only legwork. The default,
claude-code, needs theclaudebinary on PATH (npm install -g @anthropic-ai/claude-code) and a signed-in session (claude login). - Zero-config or a model credential.
claude-codeworks out of the box with just your signed-in Claude Code session — no API key required — yielding a raw, un-synthesized report (the agent’s own conclusion). Configuring any provider API key (likeOPENAI_API_KEYorOLLAMA_API_KEY) upgrades reports to fully synthesized writeups. See Providers & API keys for the full setup and alternative harnesses.
Run pl doctor to confirm both are in place — it checks the harness binary is
on PATH, a model credential is set, and the run workspace is writable, and exits
non-zero if anything required is missing (a good CI smoke check too). When a run
fails or doctor reports a problem, Troubleshooting
maps the symptom to the fix.
Then head to the Quickstart to run one end to end.
What a report looks like
Section titled “What a report looks like”Every investigation ends with the same shape, whether you read it in the
terminal or as JSON (--json):
- A root cause, if one was found — otherwise “not determined,” honestly.
- Hypotheses, ranked most to least plausible, each with the evidence that supports or contradicts it and where that evidence came from.
- What was ruled out, and why.
- Coverage — which sources were queried and which weren’t.
- Next steps to confirm or dig further.
There are no numeric confidence scores — evidence is ordered, not scored. The full JSON field list is documented in the Output shape reference.
Next steps
Section titled “Next steps”- Quickstart — install to first report, one path end to end.
- Providers — set up a model provider and harness binary for your setup.
- Commands — the full flag reference for every
plsubcommand. - Unattended alerts — point Alertmanager at
pl listenand let it investigate on its own. - Configuration —
prismalens.config.yaml, layering, and BYO-key environment variables. - Troubleshooting — when a run or
pl doctorfails.